There is nothing like a good visual to help you understand the complex, am I right?!
I love charts, and I have come across a few good ones this week.
Use them virtually through email drips, Zoom meetings, or print out and hand/send to prospects and clients to provide value and hit the message you are preaching every day.
WSJ Article to share – Despite signs of Stabilization, Long term Economic Damage is Significant.
o More ammo to send to prospects in your drip campaigns, radio or on your social around “don’t get comfortable. You need a plan”
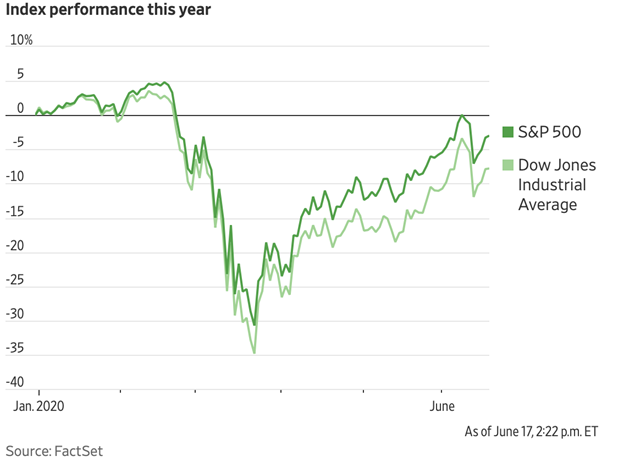
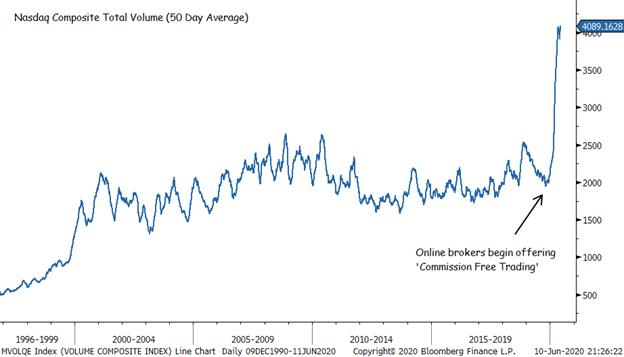
o My question after viewing this chart is “Do things feel like they are back to the normal trajectory we were on before this all happened?”
o (Sarcastic statement) We were on the longest bull run in history and in just a couple months we are back on track!!
33% of investors Older than 65 Dropped their stocks in February and May!
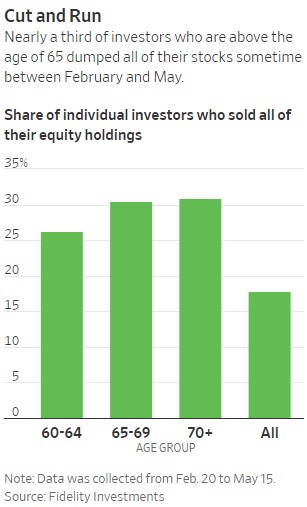
o “The stock market falls because people want to sell and people want to sell because the stock market falls.”
Super Technical, but PRO Income Annuities article from FORBES and Wade Pfau
o “Purchasing income annuities can be a win-win situation both for the consumer and the insurance company, as the benefits created through risk pooling are shared between both parties in the transaction.”
o “If a producer can provide the good or service for more cheaply than I could achieve when trying to create it on my own, while still being able to generate a profit through their specialization and economies of scale that I do not have access to, but for a lower price than I value it, then I could derive a net benefit.”
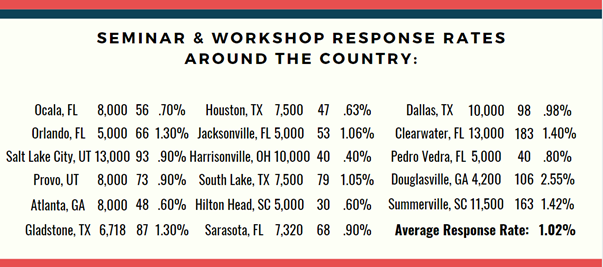
· IN-PERSON Seminar Results from the past 2 weeks:
Investors are sitting on the biggest Pile of Cash Ever!

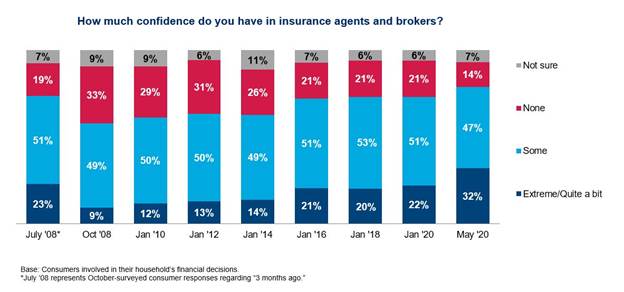
Confidence in insurance companies and agents at an all time high.
12 Reasons why the Market hasn’t crashed